How to use this sheet utilization calculator
The calculator above turns your sheet dimensions, consumed sheet count, and rectangular part list into an immediate area-based estimate. Add every part size and quantity, choose one consistent unit, and enter your actual sheets used rather than the stock you hoped to use.
It reports material utilization, waste area, estimated waste cost, and the number of whole sheets that could be removed if you reached your target utilization. The target result is a planning opportunity, not a promise that every part will nest into that number of sheets.
Teams use a sheet-material utilization calculator to establish a consistent area baseline before release.
The challenge is that utilization percentages are easy to produce and hard to interpret. A percentage can look strong while still hiding production risk, unnecessary cut complexity, or stock assumptions that fail on the floor.
Use the area-based result as a quoting and comparison baseline. Before production, run the same job through a constrained optimizer so kerf, grain, rotation, trim, defects, and physical placement determine the final sheet count.
What a sheet utilization number should represent
A useful utilization metric answers a practical question:
How much of the purchased sheet area becomes placed parts in the selected plan, given the real constraints for this job?
For the calculator above:
- The numerator is the combined area of every listed rectangular part.
- The denominator is the total area of the entered sheets consumed.
- Kerf, orientation, stock mix, defects, trim, and physical placement are not applied.
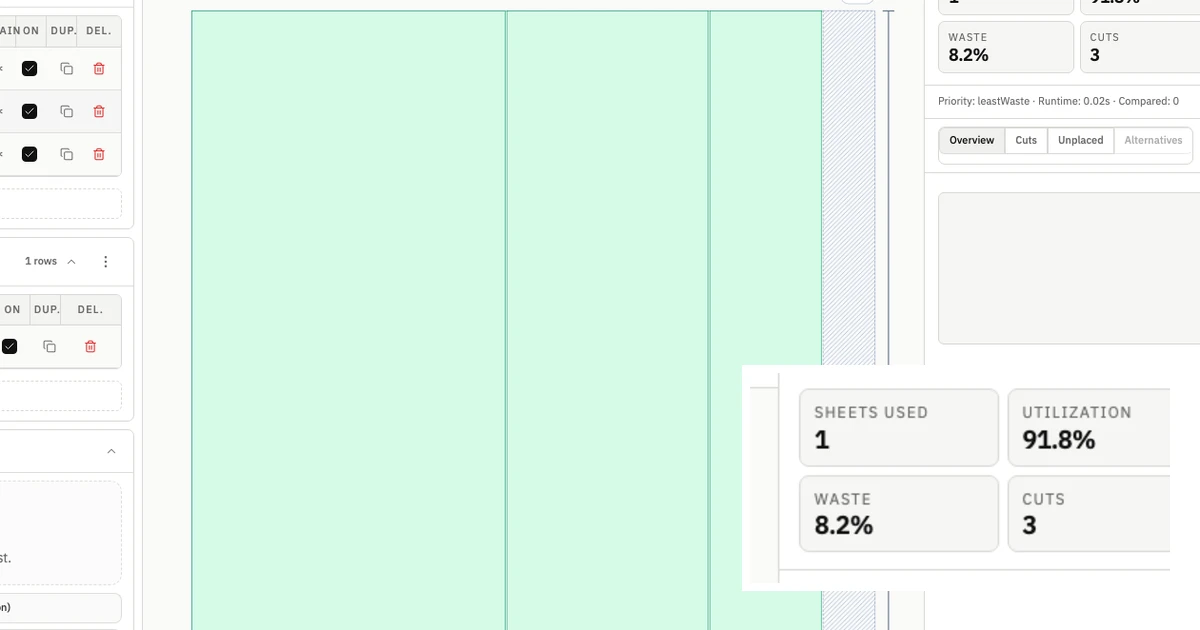
For a final production metric, use the constrained optimizer's actual placed-part and used-sheet areas. If the calculator inputs or sheet count are unrealistic, the percentage remains mathematically correct but is operationally misleading.
A simple formula that stays production-safe
Use this baseline formula:
Area estimate (%) = (Listed rectangular part area / Entered sheet area) * 100
Then track waste explicitly as the complement:
Waste (%) = 100 - Utilization (%)
For teams comparing multiple alternatives, keep both values side by side for each strategy. Do not compare utilization in one table and cuts in another view. The fastest way to create confusion is to separate KPIs from the actual chosen layout.
Why calculators fail in real projects
Most utilization calculators fail for one of four reasons:
- They evaluate ideal stock, not actual stock.
- They apply default kerf that does not match the blade in use.
- They ignore grain or orientation rules until late in review.
- They compare strategies before constraints are fully set.
Each issue can shift the final utilization by enough to change the plan decision.
Example failure mode
A quoting estimate can fall after production setup even when part demand does not change. Late kerf correction, orientation enforcement, or replacing unavailable stock changes the scenario against which utilization was calculated.
Setup checklist before you trust the number
Run this checklist before you accept any material utilization output:
- Units are consistent across all inputs.
- Duplicate part rows are removed.
- Stock dimensions and sheet counts reflect availability.
- Kerf is configured for current blade thickness.
- Orientation or grain constraints are applied where required.
- Unplaced parts are reviewed and not ignored.
If one item fails, treat the utilization number as provisional.
For teams that need a full setup flow, start in the live CutOps workspace and validate the checklist before final comparison.
Set a baseline for the actual workflow
No universal utilization range separates a good plan from a bad one. Useful targets come from accepted historical jobs that share the same important assumptions:
- Material and stock dimensions
- Part geometry and production volume
- Kerf, trim, grain, and rotation rules
- Fixed or purchasing-oriented stock assumptions
- Required cut simplicity and handling limits
Enter a target derived from that comparable history, then treat the calculator's difference from the target as a prompt for review rather than a pass or fail grade. A lower-utilization plan can still be the better decision when it reduces rework, handling, or unplaced-part risk.
Compare alternatives with context, not headlines
A utilization calculator is most useful when it supports strategy comparison rather than a single default run.
At minimum, compare:
- Utilization (%)
- Waste (%)
- Total cuts
- Cut length
- Sheets used
- Unplaced parts
Then decide with business context:
- Is material cost or throughput the current priority?
- Is this a one-off project or a repeatable product family?
- Is operator readability more valuable than a minor utilization gain?
To structure this review, use the strategy-focused page on compare optimization strategies and keep the chosen layout tied to the same KPI row.
Kerf is the fastest way to break utilization trust
If your kerf is wrong, every area-derived metric loses reliability.
That is why utilization analysis should include a kerf check before sign-off:
- Confirm current blade thickness.
- Confirm kerf value in the optimizer.
- Re-run alternatives after kerf updates.
- Re-check unplaced parts and waste pattern.
When teams skip this, they often select a plan that looks efficient and then requires emergency adjustment in production.
Use the practical setup flow in kerf-aware cut list optimizer guidance when your team changes blades frequently or sees repeated fit drift.
Build a repeatable utilization review cadence
A reliable calculator process is less about one perfect run and more about consistent cadence:
- Load parts and stock.
- Validate setup baseline.
- Apply constraints.
- Run at least two strategy variants in CutOps.
- Compare KPIs and layout readability together.
- Select and export from the same decision context.
- Capture post-run outcomes.
This sequence is short enough for daily use and strong enough for auditability.
Common interpretation mistakes and fixes
Mistake: treating utilization as the only success metric
Fix: keep cut count and cut length visible in the same row. High utilization with extreme cut path can increase labor and defect risk.
Mistake: comparing different stock assumptions
Fix: freeze stock model before strategy comparison. If stock assumptions change, restart the comparison set.
Mistake: ignoring unplaced parts because utilization looks good
Fix: zero-unplaced is a release gate condition unless the business explicitly accepts partial allocation.
Mistake: forcing one benchmark across all materials
Fix: derive separate baselines from accepted jobs with comparable material, stock, geometry, constraints, and production requirements.
What to record after each project
If you want your utilization calculator process to improve over time, capture the same post-run fields on every completed job:
- Planned utilization vs final accepted utilization.
- Final waste percentage.
- Selected strategy and why it won.
- Late changes to kerf or orientation settings.
- Any unplaced parts and resolution path.
This record turns isolated project outcomes into default-setting intelligence for future runs.
A practical decision rule for close alternatives
Many teams face near-identical alternatives where headline KPIs differ by very small amounts. In this case, define a threshold so the team does not over-optimize noise.
A practical rule is to treat tiny cut-length gaps as equivalent and decide by readability or handoff clarity. This avoids unnecessary switching between near-identical plans and keeps execution stable.
Where this fits in CutOps
CutOps keeps utilization analysis in the same workspace as layout review and export, which removes a common source of planning drift.
Use this workflow:
- Open a project in the optimizer workspace.
- Apply kerf and orientation constraints before serious comparison.
- Run and review alternatives in one results context.
- Select the plan with balanced operational fit, not just top-line utilization.
- Export from the chosen state without reformatting.
When the utilization metric is grounded in realistic constraints, it becomes a planning signal you can trust across estimator, planner, and operator handoff.
Final takeaway
A material utilization calculator for sheets is not just a formula. It is a decision system.
The percentage matters only when it is interpreted against real stock, constraints, and workflow priorities. A repeatable review process makes changes in waste, planning time, and production risk measurable instead of assumed.
If your current numbers change dramatically between quote and production, the fix is usually not a better spreadsheet. The fix is a tighter setup and comparison process that keeps utilization, strategy, and export in one controlled flow.